Clifford F. Thies1 Abstract
The Chicago Record poll of the Presidential election of 1896 was an enormous, multi-state, mail survey. Unfortunately, its results were incredible. The newspaper attempted to correct the results, making perhaps the first ever attempt to deal with nonresponse bias, but did not have much success. Had responses been properly corrected for differences in response rate, the poll would have generated a satisfactory set of predictions.
Keywords
nonresponse bias, election of 1896, Chicago Record poll
Introduction
According to the St. Louis Republican (“Politics in the Great Corn Belt,” Oct. 13, 1896, p. 3), Thomas Snell was the “political barometer” of the region because he had, during the prior forty years, won $400,000 betting on national elections. Snell, the newspaper said, had never lost a bet on the outcome of a presidential election. In mid October, he is quoted as saying, “I feel in my bones that Bryan will be elected. But until I can get some definite information about the labor vote, I’m not going to bet much.” In claiming to not be sure of the outcome, Snell might have been attempting to sucker Bryan enthusiasts.
By mid October, the betting odds strongly favored William McKinley, the nominee of the Republican Party, over William Jennings Bryan, the nominee of the Democratic Party (Rhode and Strumpf, 2004). Given the importance of the election for the gold standard, it is also informative that the forward exchange premium on the British pound relative to the domestic commercial paper rate (Calomiris, 1993) and the premium on gold bonds relative to dollar bonds (Thies, 2005) had both fallen to near zero. Other information included several state elections during the months prior to the Presidential election; and, various polls including, most significantly, the Chicago Record poll, a mail survey of 240,000 voters. By October 13th, this survey indicated that McKinley would score a landslide victory in the city of Chicago. By October 20th, it indicated that he would easily win ten of the twelve states covered by the survey.
While McKinley was in fact elected, the Chicago Record poll proved to be wildly off the mark. Of the states covered, Bryan won four. And, in the states McKinley won, his margins of victory were much lower. The failure of the Chicago Record poll can be attributed to nonresponse bias, viz., a lower response rate in counties that had voted more heavily for the Democratic and Populist candidates in the prior Presidential election. This paper shows that by properly weighting responses to correct for nonresponse bias, reasonable predictions could have been obtained.
The rest of the paper is organized as follows: First, in the way of background, the evolution of surveys of voting intentions in the United States is outlined; and, the election of 1896 is briefly described. Then, the straw polls and other information indicative of voting intentions in the election of 1896 are presented, including the Chicago Record poll. Finally, some of the uses of polling during the election of 1896 are discussed.
The Evolution of Polling
According to Smith (1990), the first political polls were conducted during the election of 1824. The early polls are today characterized as “straw polls,” indicating that they were not based on random sampling. However, at the time, the term “straw poll” indicated only that the poll was a “straw in the wind,” showing which way the wind was blowing. By the election of 1856, publication of straw polls had become rather commonplace (Herbst, 1993).
The early straw polls usually showed large majorities favoring the candidate endorsed by the newspaper and sometimes included a gratuitous insult. For example, in 1856, one newspaper reported a straw poll in which the Democratic Party candidate, James Buchanan, was supported by 331, the American Party candidate, Millard Fillmore, by 12, and the Republican Party candidate, John C. Fremont, by 1; and, also said “The Fremonter was arrested the next day for stealing a pair of boots.” (“An Indicative Vote,” Nashville Union and American Aug. 7, 1856, p. 2) In 1864, another newspaper reported a straw vote in which the Republican candidate, Abraham Lincoln, was supported by 32, and the Democratic candidate, George B. McClellan, by 7; and, “Of the seven who voted for McClellan, two were deserters, being brought in with handcuffs around their wrists.” (“Another Train Vote,” Milwaukee Daily Sentinel Oct. 20, 1864, p. 1) These polls were clearly “designed for readers’ entertainment and partisan jockeying.” (Igo 2007, p. 106) Herbst (1993, p. 86) says that “since straw polls were not scientifically conducted, and were rarely replicated, they could not provide definitive evidence about election outcomes.”
By the late 19th century, newspapers developed several techniques to gather more objective information. One technique involved cluster sampling. Using this technique, agents of the newspaper surveyed people in pre-selected locations so that, when the surveys of these clusters were amassed into one sample, the sample might reflect the voting population. An example is a five-cluster survey conducted by the New York Evening World (Oct. 23-27, 1888). A small band of employees surveyed people (1) on a commuter train, (2) at the wharves, (3) on a commuter ferry, (4) on streetcars, and (5) at the fish and meat markets. The survey found small pluralities for Grover Cleveland, the Democrat, over Benjamin Harrison, the Republican, in the first and third clusters; and, large pluralities for Cleveland in each of the other three. Overall, 1,157 voters were included in the poll, and it favored Cleveland 62 to 31 percent.2
A second technique involved asking people to indicate for whom they had voted in the prior election as well as for whom they intended to vote in the upcoming election. With this technique, the net shift of voters from one to the other major party was the critical finding. This net shift was referred to as the “drift.” The aforementioned New York Evening World poll of 1888 indicated a negligible drift toward Cleveland, and that first-time voters were going to break for Cleveland in similar proportion to those who had previously voted.
The Chicago Record (“Methods,” Oct. 3, 1896, p. 1) poll of 1896 featured yet another technique, postcard survey forms distributed to voters. This poll consisted of two parts. The first involved the distribution of postcards to every registered voter as of April of that year in the city of Chicago and the adjacent city of Cicero. The second involved the distribution of postcards to voters constituting 10 percent of the 1892 vote in the state of Illinois outside of Chicago and Cicero, as well as the same percentage of voters in 11 other Midwestern and Border states. In the second part of the poll, the postcards were provided to local postmasters with separate quotas for the urban and rural areas of counties with large towns and cities. The postmasters were asked to distribute the postcards to voters alphabetically, until the quotas were exhausted.
The design of the poll might appear sound, but its results were fantastical. The design avoided the famous problem of the Literary Digest poll of 1936, which relied on lists of owners of automobiles and subscribers to telephone service, which lists were not representative of the voting population. However, the design did not avoid the less well-known problem of the Literary Digest poll, of nonresponse bias (Squire, 1988).
While the most famous criticism of the pre-election polls of 1948, “Dewey defeats Truman” election is that they should have continued polling through to the election instead of stopping two weeks prior, a second criticism concerned bias (Mosteller, 1949). At the time, polls employed quota systems to generate representative samples. Although the quotas assured representativeness according to pre-identified characteristics of the population, the quota system resulted in bias within the cells defined by the quota. In particular, the polls of 1948 over- sampled people having higher income. The argument was therefore made for probability sampling. Probability sampling became practical with near universal telephone service (initially landline and later landline and cell phone). Pre-election polls have arguably delivered satisfactory results since the shift to probability sampling (Panagopoulos, 2009; Panagopoulos & Farrer, 2014).3
With falling response rates to telephone-based surveys, the potential for nonresponse bias has emerged as a concern in contemporary polling (see Groves, 2006; Massey & Tourangeau, 2013; and their associated issues). The now standard adjustment is to weight responses using demographic information. Groves and Peytcheva (2008), Krueger and West (2014) and Olson (2013) discuss the use of “paradata”, such as “neighborhood observations,” to make post-survey adjustments to correct for differences in response rates. Reexamination of the Chicago Record poll of 1896 is therefore of current interest. Would the poll have delivered satisfactory forecasts if its responses had been properly weighted?
The Election of 1896
The election of 1896 is described as a pivotal election in that it was instrumental in a political realignment (Jones, 1964; Williams, 2010). To Republicans, the election was about maintaining the gold standard and high tariffs. These, Republicans argued, maintained the jobs and purchasing power of industrial workers. In contrast, according to Democrats, unemployment and industrial bankruptcies were high during the 1890s due to the gold standard. According to them, the act of the Congress that committed the country to a gold standard had resulted in ruinous deflation.
Jensen (1971, p. 10) argues that money was only “superficially…the overriding issue” of the election of 1896. More fundamentally, to the Democrats, the election was about subordinating economic policy to what best served the majority of people. Thus, Bryan ended his speech at the Democratic National Convention, “You shall not crucify mankind on a Cross of Gold,” casting the money issue in moralistic terms. To the Republicans, the money issue was also moralistic, a bargain between one class and another that would, in the long run, benefit the members of both classes.
Politically, the election concerned whether the Democrats could amalgamate a majority from among their Jim Crow brethren in the South, silver interests in the far west, farmers in the prairie west, and farmers and industrial workers in the Midwest. While the new Democratic coalition strengthened the position of immigrant-dominated big city Democrats in the Northeast within their states, it weakened the Democratic Party in that section of the county, and shifted power within the party southward and westward (Kleppner, 1987, pp. 107-108).
More immediately, the money issue allowed the Democratic nominee to also be nominated by the Populist Party (Bensel, 2000, p. 236). The Populist Party got 8.5 percent of the nationwide popular vote in the election of 1892, and cost the Democratic Party the five states it [the Populist Party] won, and possibly also seven other states in which it and the Democratic Party together outpolled the Republicans.
During the election of 1896, the Republicans drew large crowds, both to McKinley’s front porch, where – in the then tradition of Presidential campaigns – he offered “remarks,” as well as in their military-style parades in the larger towns and cities of the North. Bryan, in a break with tradition, campaigned throughout the country, and drew unbelievably large crowds.
Assessing Public Opinion in 1896
From the 19th century into the 20th, various states conducted state elections during the months prior to the Presidential election. During the early part of the 19th century, when the Whigs and the Democrats were each competitive in the North and in the South, the results of many of these state elections were informative regarding the upcoming Presidential election (e.g., the election of 1844, Pecquet & Thies, 2006). But, by the late 19th century, only some state elections were informative, the most prominent being Maine. Indeed, until the election of 1940, Maine enjoyed the reputation of a bellwether state, and the phrase “As Maine goes, so goes the nation” was part of the political lexicon (Robinson, 1932, p. 161). Robinson (1932, p. 177) makes the point that the size of the plurality of the Republican candidate for Governor of Maine was significant. He said that during the late 19th century, a normal plurality for a winning Republican candidate was 15 to 20,000 votes. Accordingly, in 1896, Republican newspapers were jubilant upon the news of a resounding, 50,000-vote plurality by the Republican candidate. “Now that the election is over and the forces of silver and Anarchy are routed, the excitement and uncertainty of the last month have disappeared,” proclaimed the New York Tribune (“Maine’s High Water Mark,” Sept. 16, 1896, p. 1).
Democratic newspapers pointed instead to their victories in the South. “Arkansas Democratic by 60,000 Majority,” headlined the New York Journal (Sept. 8, 1896, p. 2) one day, and “Arkansas Vote is growing larger,” the next (Sept. 9, 1896, p. 1). During the months of September and October, the Republicans were victorious in two New England states, while the Democrats were victorious in four Southern states. Given the political map of the time, with the Northeast conceded to the Republicans, and the South conceded to the Democrats, it is not clear that any of these state elections were informative.
Local Observers
Another source of information was local observers. To illustrate, N.W. Harris Co., a banking house in Chicago, says it conducted a mail survey of country merchants in Minnesota and North Dakota (“Farmers and Cheap Money,” Chicago Tribune Sept. 23, 1896, p. 3). Survey forms were sent to as many as six merchants per town, asking whether the merchants thought the Democratic vote in their area would increase, decrease or stay the same. In Minnesota, 273 merchants said “decrease,” while 195 said “increase” and 101 said “stay about the same.” Since the Republicans carried the state by 8.2 percentage points in 1892 when the Democrats and Populists were split, these replies indicated that the Republicans could again win the state, even against a united opposition. In North Dakota, 69 merchants said the Democratic vote would “decrease,” while 61 said “increase” and 28 said “stay about the same.” Since the Populists carried the state by a mere 0.5 percentage points in 1892, these replies indicated that the vote would again be close, and that the Republicans had a chance of winning.
The New York Life Insurance Co. conducted a survey of 32,000 “correspondents” (“Victory for McKinley,” New York Herald, Sept. 18, 1896, p. 6). Each correspondent was asked to name the probable winner of his state. If more than 85 percent of correspondents within a particular state said Bryan would win (or, that McKinley would win), the state might be considered to be “certain” for Bryan (conversely, “certain” for McKinley). If between 65 and 85 percent said Bryan would win, that state might be considered “probable” for Bryan. Finally, if between 35 and 65 percent said Bryan would win, that state might be considered to be a “toss-up.” The survey indicated that McKinley was the clear favorite in that Bryan would have to win all or almost all of the toss-up states as well as some of those probable for McKinley. As it turned out, every state described as either certain or probable ended up as predicted. Of the nine toss-up states, five went one way, and four the other.
Straw Polls
By mid October, a large number of straw polls had been conducted, the results of which were overwhelmingly favorable to the Republicans.4 As the Fort Wayne Weekly Gazette (“The Straw Vote,” October 15, 1896, p. 8) put it, “Nearly every train that has been polled, nearly every factory that has been polled, nearly every non-political assembly that has been polled has shown an average of about four for McKinley to one for Bryan. The soldiers’ reunions have stood from ten to twenty for McKinley for every vote for Bryan. The post card vote, started by the Chicago Record, gave about 31⁄2 votes for McKinley to one for Bryan.” These results were simply too favorable for the Republicans to be credible.
Focusing on industrial workers, in a survey of 13,182 workingmen in Illinois conducted by correspondents of the Chicago Tribune (“Poll of Artisans,” Sept. 21, 1896, p. 3), 84 percent were found to favor McKinley and 13 percent Bryan. The survey was conducted at workplaces – a great many workplaces – such as Huff Brother’s Lumber Mill in Decatur, where 24 workers cast straw votes in favor of McKinley and 3 in favor of Bryan.
The Minneapolis Journal (“The First Straw Poll, Aug. 3, 1896, p. 6; “McKinley 208, Bryan 44,” Aug. 15, 1896, p. 2; and, “Straw Vote on a Big Scale,” Oct. 10, 1896, p. 4) also conducted surveys of workers at their places of work, a total of 1,513 workers. It found that 79 percent were in favor of McKinley and 19 percent Bryan. The Atlantic [IA] Weekly Telegraph (“A Few Straws,” Sept. 9, 1896, p. 6) reported several surveys in the Midwest totaling 3,080 workers at their places of work, finding 81 percent to favor McKinley and 18 percent to favor Bryan. The New York Evening World (“Not one man for Bryan,” Oct. 1, 1896, p. 4) polled 4,338 workers at their places of work, and found 59 percent favoring McKinley and 39 percent favoring Bryan. The New York Evening World surmised that McKinley’s support among workers was mainly from skilled workers, while Bryan’s was mainly from unskilled workers.
While some surveys of workers are reported by Democratic newspapers, these surveys are not comparable in number or size to those reported by Republican newspapers. Democratic newspapers mainly argued that employers were intimidating workers or misrepresenting their voting intentions. Henry George, writing as a correspondent for the New York Journal (“Henry George’s Views,” Sept. 19, 1896, p. 2), said, “railroad men are prevailed upon by their employers who say the bonds owed by their companies would go to a premium.” The Semi- Weekly Interior Journal (Oct. 9, 1896, p. 4) of Sanford, Kentucky, said that when the straw vote of workers at the Elgin Watch Co., of Illinois (a workplace included in the Chicago Tribune’s survey discussed above) was reported by the superintendent, it was overwhelmingly in favor McKinley. But, the “actual vote” was 486 for Bryan, 244 for McKinley and 79 undecided.
The Omaha World-Herald (“One Secret Straw Ballot,” Sept. 21, 1896, p. 2) said that “sixteen laborers on the Illinois Central at Cobdin, Illinois, have been discharged for advocating Bryan and free silver, and replaced by Italians.” The Lima [OH] Times Democrat (“More Worms Turn,” October 23, 1896, p. 1) said that a St. Louis dry goods merchant had been arrested for “attempting to influence an elector,” as he had dismissed twelve employees because they had expressed intentions to vote for Bryan.5
The Chicago Record Poll
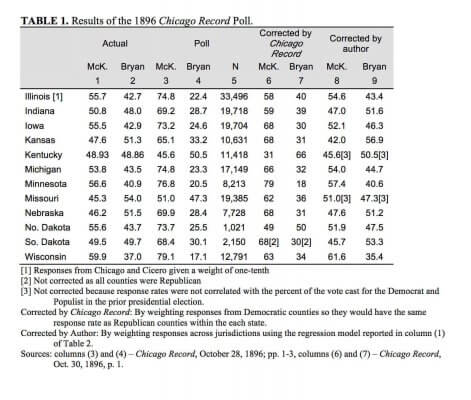
As stated above, the Chicago Record poll was a multi-state, mail survey sent to voters numbering ten percent of the vote in the prior Presidential election, except in Chicago and Cicero where the survey was sent to all registered voters as of April 1896. Postcards constituting the survey forms were distributed in waves, beginning in early October, with replies tabulated and published as they were received until October 28th. About 240,000 replies were received, giving an overall response rate of 30 percent. As Table 1 shows, the poll indicated that McKinley would score a landslide victory. For ten of the twelve states in the survey, including Bryan’s home state of Nebraska, McKinley would pile up enormous margins of victory. In the remaining two states – Kentucky and Missouri – McKinley would be competitive.
Soon after replies started to be tabulated, Democrats denounced the poll. The Chicago Dispatch, a Democratic newspaper, called it “the most colossal, unmitigated political crime of the 19th century.” (“Bryanites Rattled,” Titusville Herald Oct. 10, 1896, p. 1) Democrats complained that workers did not have time to fill out their cards and did not have ready access to writing implements. They thought Bryan’s performance would improve upon the passing of a weekend. When this anticipated improvement did not materialize, they called for a boycott.
As the tabulation of the poll neared completion, Democratic newspapers changed their tune, saying that the Chicago Record poll pointed to a victory because it showed a drift to Bryan (“Those Postal Card Primaries,” Los Angeles Herald Oct. 27, 1896, p. 2). On the plus side for the Democrats, the Chicago Record poll did, in fact, show a strong net shift of those in Kansas who had voted Republican in 1892, to Bryan. This drift, combined with the fact that Kansas went Populist in 1892, indicated that that state would go for Bryan. Furthermore, the poll showed a small drift to Bryan, or no drift either way, in Indiana, Kentucky, Missouri, Nebraska and North and South Dakota, in which states the combined Democratic and Populist vote exceeded the Republican vote four years prior.
On the minus side for the Democrats, the Chicago Record poll showed a strong net shift in Illinois and Wisconsin to McKinley, which states went Democratic in 1892, indicating that those states might flip Republican. A drift was shown to McKinley, or no drift either way, in Iowa, Michigan and Minnesota, which states had voted Republican four years prior.
Losing Illinois and Wisconsin, while winning Indiana, the Border states of Kentucky and Missouri, and the Plains states of Kansas, Nebraska, North and South Dakota would not have been disastrous for the Democrats. And, so, calculations of the drift offered the Democrats hope. But, calculations of drift are often beset by problems such as first-time voters, shifts between major and minor parties, shifts between voting and not voting, and mistaken recollections.
Adjusting the Chicago Record Poll
When the Chicago Record (Oct. 30, 1896, p. 1) finished its tabulations, it grappled with the problem of response rates being lower, in most states, in the counties in which most responses favored Bryan, possibly due, as the newspaper put it, to efforts by Democrats to “shrink” the number of responses. After consultation with a statistician at the University of Chicago, the newspaper adjusted the results within states to what they would be if the response rates of Democratic and Republican counties had been equal within states. These adjusted results are displayed in Columns 6 and 7 of Table 1. While the adjusted results tempered McKinley’s margin of victory in several states, even in these states the forecasts remain far from the mark.
The correction by the Chicago Record for nonresponse bias is possibly the first such attempt in the history of polling, and deserves recognition if not admiration. Unfortunately, the technique employed by the newspaper was incorrect (unless all counties were either 100 percent Democratic or 100 percent Republican). If, for example, a county is 60 percent Democratic and 40 percent Republican, its response rate is not “the Democratic response rate,” but a weighted average of the Democratic and the Republican response rates.
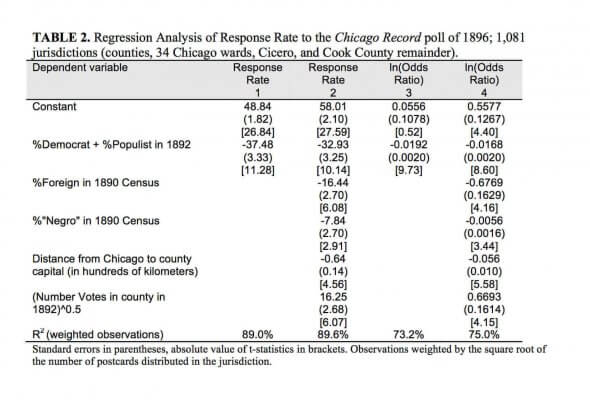
To properly adjust the results of the Chicago Record poll, response rates by jurisdiction are regressed against the percent of the vote cast for the Democratic and Populist candidates in 1892, and other variables thought to effect response rates; viz., Ri = a + b1X1i + b2X2i + … + ei; where Ri is the response rate in jurisdiction i, X1 is the percent of the vote cast for the Democratic and Populist candidates in 1892, and X2 and following are other variables effecting response rate. The results are shown in Table 2.
This regression approach improves on the Chicago Record’s attempt by measuring the partisan inclination of jurisdictions on a continuous scale. To illustrate, instead of treating all counties in South Dakota in which Bryan was favored as “Democratic counties,” and increasing their weight so that their collective response rate would equal that in the “Republican counties” in that state, responses from jurisdictions throughout the region are given weights reflecting the degree to which they favored one or the other candidate.
The regression reported in column 1 implies that in a hypothetical jurisdiction with 100 percent Republicans, the response rate would be 49 percent; while in a hypothetical jurisdiction with 100 percent Democrats, the response rate would be 12 percent. This very large difference in response rates means that jurisdictions with large percentages of Democratic voters must be given greater weight to correct for differences in response rate.
Using the parameter estimates reported in Column 1 of Table 2, Columns 8 and 9 of Table 1 report the results of the Chicago Record poll corrected for differences in response rate. The corrected results call 9 of the 12 states correctly; and, in the 3 miscalls (Indiana, Kentucky and Missouri), the corrected results correctly identify the states as competitive. The corrected results have an average error [-2.5] much lower than the average error of either the uncorrected results [33.2] or the Chicago Record’s corrected results [19.2].6 In a sense, the corrected results are over-corrected, since a large pro-McKinley average error is transformed into a small pro- Bryan average error. To be sure, the corrected results have mean absolute errors larger than would be expected given the sample sizes. But, this result could be due to a variety of reasons, e.g., late shifts in public opinion.
Discussion
By mid October, a variety of information pointed to a Republican victory, so much so that the betting odds had moved prohibitively in McKinley’s favor. While many of the survey-based data are difficult to assess, the sheer volume of straw polls in which workers expressed a strong preference for McKinley indicated that part of Bryan’s strategy – appealing to workers in the emerging industrial states of the Midwest – was not working.
The Chicago Record poll, at one level, confirmed the results of the mass of straw polls, in that it indicated that McKinley would score enormous victories in ten of the twelve states included surveyed. But, at another level, this poll did not confirm anything since it was not believable even after it was corrected for differences in response rate by its sponsor. However, with a better job of correcting for differences in response rate, the poll delivers results that are arguably acceptable, which results indicate that Bryan was in trouble in the Midwest.
Greer (1991, p. 449) argues that Bryan miscalculated for lack of credible poll data. Possibly, with credible poll data, Bryan might have handled the money issue more deftly so as so better placate industrial workers’ concern for the purchasing power of their wages. Contrariwise, the Republicans must have been encouraged by the polling data that was available that indicated that their strategy of appealing to industrial workers on the money and tariff issues was working.
According to Jones (1964, p. 157), the Midwest was the crucial region of the country for Bryan, with its mix of farmers and industrial workers. Although Bryan drew enormous crowds on his campaign swings through the Eastern and Midwestern regions, his appeals “won over few voters among urban working men.” (p. 316) Republicans, on the other hand, were relentless in their efforts to convince workers that their jobs and the purchasing power of their wages were protected by sound money and the tariff (pp. 333-335).
While free silver was the defining issue of the election of 1896, the winning issue for the Republicans could be said to have been the tariff. Party orators were sent out with the admonishment to “talk tariff, think tariff, dream tariff.” And, McKinley said of himself, “I am a tariff man, standing on a tariff platform” (Williams, 2010, p. 139). Republicans appealed to workingmen, making the case that their earnings, as well as the profits of their employers, were protected by the tariff.
But, the Republicans may have also been handicapped by the lack of credible polling data. The mass of unscientific surveys of workingmen reported by Republican newspapers combined with the terribly biased poll conducted by the Chicago Record may have convinced Republicans that their appeals to workingmen were more successful than turned out to be the case. While the Republicans won the election, it was by a much more narrow margin than had been projected.
Footnotes
- Shenandoah University, USA
Corresponding Author:
Clifford F. Thies, Byrd School of Business, Shenandoah University, 1640 University Dr., Winchester, VA 22601, USA.
Email: cthies@su.edu
- Cleveland carried New York City 60 to 39 percent, hardly different from his margin in the prior election.
- For more on the recent history of polling, see Hillygus (2011).
- This statement is based on searches of three databases of machine-readable newspapers, and scans of microfilm reels of the New York Journal (a highly-partisan Democratic newspaper) and the Chicago Tribune (a highly-partisan Republican newspaper). Bound volumes of the Chicago Record were accessed for the data of its poll.
- The charge was later dropped (“On a technicality,” Elgin [IA] Echo, Nov. 5, 1896, p. 2). 6. Martin, et al. (2005) distinguish between sampling error and bias.
- Martin, et al. (2005) distinguish between sampling error and bias.
References
Bensel, R.F. (2000). The political economy of American industrialization, 1877-1900. London: Cambridge University Press.
Calomiris, C.W. (1993). Greenback resumption and silver risk: The economics and politics of monetary regime change in the United States, 1862–1900. In M.D. Bordo & F. Capie (Eds.), Monetary regime transformations (pp. 86–132). London: Cambridge University Press.
Geer, J.G. (1991). Critical realignment and the public opinion poll. Journal of Politics, 53(2), 434-453.
Groves, R.M. (2006). Nonresponse rates and nonresponse bias in household survey. Public Opinion Quarterly, 70(5), 646-675.
Groves, R.M., & Peytcheva, E. (2008). The impact of nonresponse rates on nonresponse bias: A Meta-analysis. Public Opinion Quarterly, 72(2), 167-189.
Herbst, S. (1993). Partisan politics and the symbolic use of straw polls, 1856-1936.” In Numbered voices: How opinion polling has shaped American politics (pp. 69-87). Chicago: University of Chicago Press.
Hillygus, D.S, (2011). The evolution of election polling in the United States. Public Opinion Quarterly, 75(5): 962-981.
Igo, S.E. (2007). The averaged American: Surveys, citizens, and the making of a mass public. Cambridge, MA: Harvard University Press.
Jensen, R.J. (1971). The winning of the midwest: Social and political conflict, 1888-1896. New York: University of Chicago Press.
Jones, S. (1964). The presidential election of 1896. Madison, WI: University of Wisconsin Press.
Kleppner, P. (1987). Continuity and change in electoral politics, 1893-1928. Westport, CT: Greenwood Press.
Krueger, B.S., & West, B.T. (2014). Assessing the potential of paradata and other auxiliary data for nonresponse adjustments. Public Opinion Quarterly, 78(4), 795-831.
Martin, E.A., Traugott, M.W., & Kennedy, C. (2005). A review and proposal for a new measure of poll accuracy. Public Opinion Quarterly, 69(3), 342-369.
Massey, D.S., & Tourangeau, R. (2013). New challenges to social measurement. Annals of the American Academy of Political and Social Science, 645(1), 6-22.
Mosteller, F., Hyman, H., Philip McCarthy, P., Marks, E., & Truman, D. (1949). The pre- election polls of 1948; report to the committee on analysis of pre-election polls and forecasts. New York: Social Science Research Council.
Olson, K. (2013). Paradata for Nonresponse Adjustment. Annals of the American Academy of Political and Social Science, 645(1), 142-170.
Panagopoulos, C. (2009). Polls and elections: Preelection poll accuracy in the 2008 general elections.” Presidential Studies Quarterly, 39(4), 896-907.
Panagopoulos, C., & Farrer, B. (2014). Preelection poll accuracy and bias in the 2012 general elections. Presidential Studies Quarterly, 44(2), 352-363.
Pecquet, G.M., & Thies, C.F. (2006). Texas treasury notes and the election of 1844. Independent Review, 11(2), 237-262.
Rhode, P.W., & Strumpf, K.S. (2004). Historical presidential betting markets. Journal of Economic Perspectives, 18(2), 127–42.
Robinson, C.E. (1932). Maine – political barometer. Political Science Quarterly, 47(2): 161-184.
Smith, T.W. (1990). The first straw: A study of the origins of election polls. Public Opinion Quarterly, 54(1), 21-36.
Squire, P. (1988). Why the 1936 Literary Digest poll failed. Public Opinion Quarterly, 52(1), 125-133.
Thies, C.F. (2005). Gold bonds and silver agitation. Quarterly Journal of Austrian Economics, 8(4), 67-86.
Williams, R.H. (2010). Realigning America: McKinley, Bryan, and the remarkable election of 1896. Lawrence, KS: University Press of Kansas.
Author Biography
Clifford F. Thies is the Eldon R. Lindsey Chair of Free Enterprise and Professor of Economics and Finance at Shenandoah University. He has written extensively on historical intersections of economics and politics. Recently, he and Gary Pecquet of Central Michigan have reconsidered Woodrow Wilson’s transformation from a conservative to a progressive Democrat, and Warren Harding’s abysmal ranking among historians. Thies and Pecquet are currently conducting a cross-cultural investigation of giving.